This is a task from the Illustrative Mathematics website that is one …
This is a task from the Illustrative Mathematics website that is one part of a complete illustration of the standard to which it is aligned. Each task has at least one solution and some commentary that addresses important aspects of the task and its potential use.
This task can be used as a quick assessment to see if …
This task can be used as a quick assessment to see if students can make sense of a graph in the context of a real world situation. Students also have to pay attention to the scale on the vertical axis to find the correct match.
This is a task from the Illustrative Mathematics website that is one …
This is a task from the Illustrative Mathematics website that is one part of a complete illustration of the standard to which it is aligned. Each task has at least one solution and some commentary that addresses important aspects of the task and its potential use.
Students create projects that introduce them to Arduino—a small device that can …
Students create projects that introduce them to Arduino—a small device that can be easily programmed to control and monitor a variety of external devices like LEDs and sensors. First they learn a few simple programming structures and commands to blink LEDs. Then they are given three challenges—to modify an LED blinking rate until it cannot be seen, to replicate a heartbeat pattern and to send Morse code messages. This activity prepares students to create more involved multiple-LED patterns in the Part 2 companion activity.
This task is meant to be a straight-forward assessment task of graph …
This task is meant to be a straight-forward assessment task of graph reading and interpreting skills. This task helps reinforce the idea that when a variable represents time, t=0 is chosen as an arbitrary point in time and positive times are interpreted as times that happen after that.
This is a task from the Illustrative Mathematics website that is one …
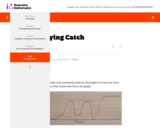
This is a task from the Illustrative Mathematics website that is one part of a complete illustration of the standard to which it is aligned. Each task has at least one solution and some commentary that addresses important asects of the task and its potential use. Here are the first few lines of the commentary for this task: A model airplane pilot is practicing flying her airplane in a big loop for an upcoming competition. At time $t=0$ her airplane is at the bottom of the ...
This is a task from the Illustrative Mathematics website that is one …
This is a task from the Illustrative Mathematics website that is one part of a complete illustration of the standard to which it is aligned. Each task has at least one solution and some commentary that addresses important aspects of the task and its potential use.
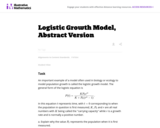
This problem introduces a logistic growth model in the concrete setting of …
This problem introduces a logistic growth model in the concrete setting of estimating the population of the U.S. The model gives a surprisingly accurate estimate and this should be contrasted with linear and exponential models, studied in ``U.S. Population 1790-1860.'' This task requires students to interpret data presented.
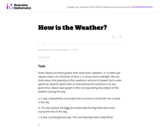
In this task students are given graphs of quantities related to weather. …
In this task students are given graphs of quantities related to weather. The purpose of the task is to show that graphs are more than a collection of coordinate points, that they can tell a story about the variables that are involved and together they can paint a very complete picture of a situation, in this case the weather.
This is a task from the Illustrative Mathematics website that is one …
This is a task from the Illustrative Mathematics website that is one part of a complete illustration of the standard to which it is aligned. Each task has at least one solution and some commentary that addresses important aspects of the task and its potential use.
In the companion activity, students experimented with Arduino programming to blink a …
In the companion activity, students experimented with Arduino programming to blink a single LED. During this activity, students build on that experience as they learn about breadboards and how to hook up multiple LEDs and control them individually so that they can complete a variety of challenges to create fun patterns! To conclude, students apply the knowledge they have gained to create LED-based light sculptures.
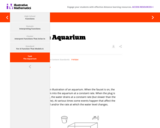
This lesson was developed for students in the U.S. Virgin Islands who …
This lesson was developed for students in the U.S. Virgin Islands who are familiar with the edible "conch," a sea snail enjoyed on the islands. Connecting this math lesson to that which is familiar to students, strengthens students' knowledge of their home and makes for a deeper, more meaningful lesson.
Students conduct an experiment to study the acceleration of a mobile Android …
Students conduct an experiment to study the acceleration of a mobile Android device. During the experiment, they run an application created with MIT's App Inventor that monitors linear acceleration in one-dimension. Students use an acceleration vs. time equation to construct an approximate velocity vs. time graph. Students will understand the relationship between the object's mass and acceleration and how that relates to the force applied to the object, which is Newton's second law of motion.
No restrictions on your remixing, redistributing, or making derivative works. Give credit to the author, as required.
Your remixing, redistributing, or making derivatives works comes with some restrictions, including how it is shared.
Your redistributing comes with some restrictions. Do not remix or make derivative works.
Most restrictive license type. Prohibits most uses, sharing, and any changes.
Copyrighted materials, available under Fair Use and the TEACH Act for US-based educators, or other custom arrangements. Go to the resource provider to see their individual restrictions.