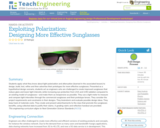
Students apply what they know about light polarization and attenuation (learned in …
Students apply what they know about light polarization and attenuation (learned in the associated lesson) to design, build, test, refine and then advertise their prototypes for more effective sunglasses. Presented as a hypothetical design scenario, students act as engineers who are challenged to create improved sunglasses that reduce glare and lower light intensity while increasing eye protection from UVA and UVB radiation compared to an existing model of sunglasses—and make them as inexpensive as possible. They use a light meter to measure and compare light intensities through the commercial sunglasses and their prototype lenses. They consider the project requirements and constraints in their designs. They brainstorm and evaluate possible design ideas. They keep track of materials costs. They create and present advertisements to the class that promote the sunglasses benefits, using collected data to justify their claims. A grading rubric and reflection handout are provided.
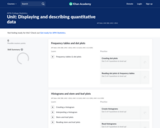
In this module, students move from simply representing data into analysis of …
In this module, students move from simply representing data into analysis of data. Students begin to think and reason statistically, first by recognizing a statistical question as one that can be answered by collecting data. Students learn that the data collected to answer a statistical question has a distribution that is often summarized in terms of center, variability, and shape. Throughout the module, students see and represent data distributions using dot plots and histograms. They study quantitative ways to summarize numerical data sets in relation to their context and to the shape of the distribution. As the module ends, students synthesize what they have learned as they connect the graphical, verbal, and numerical summaries to each other within situational contexts, culminating with a major project.
In this module, students begin their study of probability, learning how to …
In this module, students begin their study of probability, learning how to interpret probabilities and how to compute probabilities in simple settings. They also learn how to estimate probabilities empirically. Probability provides a foundation for the inferential reasoning developed in the second half of this module. Additionally, students build on their knowledge of data distributions that they studied in Grade 6, compare data distributions of two or more populations, and are introduced to the idea of drawing informal inferences based on data from random samples.
This Statistics resource was developed under the guidance and support of experienced …
This Statistics resource was developed under the guidance and support of experienced high school teachers and subject matter experts. It is presented here in multiple formats: PDF, online, and low-cost print. Statistics offers instruction in grade-level appropriate concepts and skills in a logical, engaging progression that begins with sampling and data and covers topics such as probability, random variables, the normal distribution, and hypothesis testing. This content was developed with students in mind, incorporating statistics labs, worked exercises, and additional opportunities for assessment that incorporate real-world statistical applications. For instructors, resources are available to support the implementation of the Statistics textbook, including a Getting Started Guide, direct instruction presentations, and a solutions manual.
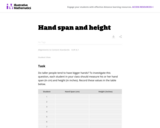
This task uses student generated data to assess standard 7.SP.7. This task …
This task uses student generated data to assess standard 7.SP.7. This task could also be extended to address Standard 7.SP.1 by adding a small or whole class discussion of whether the class could be considered as a representative sample of all students at your school.
This is a task from the Illustrative Mathematics website that is one …
This is a task from the Illustrative Mathematics website that is one part of a complete illustration of the standard to which it is aligned. Each task has at least one solution and some commentary that addresses important aspects of the task and its potential use.
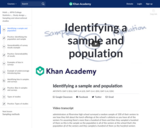
Much of statistics is based upon using data from a random sample …
Much of statistics is based upon using data from a random sample that is representative of the population at large. From that sample mean, we can infer things about the greater population mean. We'll explain.
Introductory Business Statistics is designed to meet the scope and sequence requirements …
Introductory Business Statistics is designed to meet the scope and sequence requirements of the one-semester statistics course for business, economics, and related majors. Core statistical concepts and skills have been augmented with practical business examples, scenarios, and exercises. The result is a meaningful understanding of the discipline, which will serve students in their business careers and real-world experiences.
Introductory Statistics follows scope and sequence requirements of a one-semester introduction to …
Introductory Statistics follows scope and sequence requirements of a one-semester introduction to statistics course and is geared toward students majoring in fields other than math or engineering. The text assumes some knowledge of intermediate algebra and focuses on statistics application over theory. Introductory Statistics includes innovative practical applications that make the text relevant and accessible, as well as collaborative exercises, technology integration problems, and statistics labs.
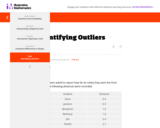
This is a task from the Illustrative Mathematics website that is one …
This is a task from the Illustrative Mathematics website that is one part of a complete illustration of the standard to which it is aligned. Each task has at least one solution and some commentary that addresses important aspects of the task and its potential use.
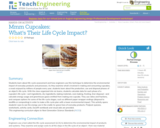
Students learn about life-cycle assessment and how engineers use this technique to …
Students learn about life-cycle assessment and how engineers use this technique to determine the environmental impact of everyday products and processes. As they examine what’s involved in making and consuming cupcakes, a snack enjoyed by millions of people every year, students learn about the production, use and disposal phases of an object’s life cycle. With the class organized into six teams, students calculate data for each phase of a cupcake’s life cycle—wet ingredients, dry ingredients, baking materials, oven baking, frosting, liner disposal—and calculate energy usage and greenhouse gases emitted from making one cupcake. They use ratios and fractions, and compare options for some of the life-cycle stages, such as different paper wrapper endings (disposal to landfills or composting) in order to make a life-cycle plan with a lower environmental impact. This activity opens students’ eyes to see the energy use in the cradle-to-grave lives of everyday products. Pre/post-quizzes, worksheets, activity cards, Excel® workbook and visual aids are provided.
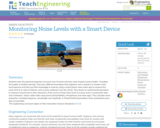
Students learn the physical properties of sound, how it travels and how …
Students learn the physical properties of sound, how it travels and how noise impacts human health—including the quality of student learning. They learn different techniques that engineers use in industry to monitor noise level exposure and then put their knowledge to work by using a smart phone noise meter app to measure the noise level at an area of interest, such as busy roadways near the school. They devise an experimental procedure to measure sound levels in their classroom, at the source of loud noise (such as a busy road or construction site), and in between. Teams collect data using smart phones/tablets, microphones and noise apps. They calculate wave properties, including frequency, wavelength and amplitude. A PowerPoint® presentation, three worksheets and a quiz are provided.
This lesson teaches students how to make decisions in the face of …
This lesson teaches students how to make decisions in the face of uncertainty by using decision trees. It is aimed for high school kids with a minimal background in probability; the students only need to know how to calculate the probability of two uncorrelated events both occurring (ie flipping 2 heads in a row). Over the course of this lesson, students will learn about the role of uncertainty in decision making, how to make and use a decision tree, how to use limiting cases to develop an intuition, and how this applies to everyday life. The video portion is about fifteen minutes, and the whole lesson, including activities, should be completed in about forty-five minutes. Some of the activities call for students to work in pairs, but a larger group is also okay, especially for the discussion centered activities. The required materials for this lesson are envelopes, small prizes, and some things similar in size and shape to the prize.
No restrictions on your remixing, redistributing, or making derivative works. Give credit to the author, as required.
Your remixing, redistributing, or making derivatives works comes with some restrictions, including how it is shared.
Your redistributing comes with some restrictions. Do not remix or make derivative works.
Most restrictive license type. Prohibits most uses, sharing, and any changes.
Copyrighted materials, available under Fair Use and the TEACH Act for US-based educators, or other custom arrangements. Go to the resource provider to see their individual restrictions.