This is a task from the Illustrative Mathematics website that is one …
This is a task from the Illustrative Mathematics website that is one part of a complete illustration of the standard to which it is aligned. Each task has at least one solution and some commentary that addresses important aspects of the task and its potential use.
In this module, students reconnect with and deepen their understanding of statistics …
In this module, students reconnect with and deepen their understanding of statistics and probability concepts first introduced in Grades 6, 7, and 8. Students develop a set of tools for understanding and interpreting variability in data, and begin to make more informed decisions from data. They work with data distributions of various shapes, centers, and spreads. Students build on their experience with bivariate quantitative data from Grade 8. This module sets the stage for more extensive work with sampling and inference in later grades.
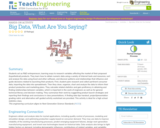
This lesson centers around the How AI Works: Equal Access and Algorithmic …
This lesson centers around the How AI Works: Equal Access and Algorithmic Bias video from the How AI Works video series. Watch this video first before exploring the lesson plan.
In this lesson, students will practice cropping images to uncover the bias underlying the Twitter cropping algorithm. Then, students will read and watch a video about the discovery of this biased algorithm. Finally, students will discuss ways to recognize and reduce bias along with analyzing Twitter's response to the allegations of bias in their cropping algorithm.
This lesson can be taught on its own, or as part of a 7-lesson sequence on How AI Works. Duration: 45 minutes
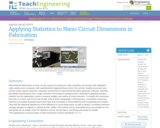
Measuring the dimensions of nano-circuits requires an expensive, high-resolution microscope with integrated …
Measuring the dimensions of nano-circuits requires an expensive, high-resolution microscope with integrated video camera and a computer with sophisticated imaging software, but in this activity, students measure nano-circuits using a typical classroom computer and (the free-to-download) GeoGebra geometry software. Inserting (provided) circuit pictures from a high-resolution microscope as backgrounds in GeoGebra's graphing window, students use the application's tools to measure lengths and widths of circuit elements. To simplify the conversion from the on-screen units to the real circuits' units and the manipulation of the pictures, a GeoGebra measuring interface is provided. Students export their data from GeoGebra to Microsoft® Excel® for graphing and analysis. They test the statistical significance of the difference in circuit dimensions, as well as obtain a correlation between average changes in original vs. printed circuits' widths. This activity and its associated lesson are suitable for use during the last six weeks of the AP Statistics course; see the topics and timing note below for details.
This learning video deals with a question of geometrical probability. A key …
This learning video deals with a question of geometrical probability. A key idea presented is the fact that a linear equation in three dimensions produces a plane. The video focuses on random triangles that are defined by their three respective angles. These angles are chosen randomly subject to a constraint that they must sum to 180 degrees. An example of the types of in-class activities for between segments of the video is: Ask six students for numbers and make those numbers the coordinates x,y of three points. Then have the class try to figure out how to decide if the triangle with those corners is acute or obtuse.
Students act as R&D entrepreneurs, learning ways to research variables affecting the …
Students act as R&D entrepreneurs, learning ways to research variables affecting the market of their proposed (hypothetical) products. They learn how to obtain numeric data using a variety of Internet tools and resources, sort and analyze the data using Excel and other software, and discover patterns and relationships that influence and guide decisions related to launching their products. First, student pairs research and collect pertinent consumer data, importing the data into spreadsheets. Then they clean, organize, chart and analyze the data to inform their product production and marketing plans. They calculate related statistics and gain proficiency in obtaining and finding relationships between variables, which is important in the work of engineers as well as for general technical literacy and decision-making. They summarize their work by suggesting product launch strategies and reporting their findings and conclusions in class presentations. A finding data tips handout, project/presentation grading rubric and alternative self-guided activity worksheet are provided. This activity is ideal for a high school statistics class.
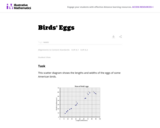
This task asks students to glean contextual information about bird eggs from …
This task asks students to glean contextual information about bird eggs from a collection of measurements of said eggs organized in a scatter plot. In particular, students are asked to identify a correlation and use it to make interpolative predictions, and reason about the properties of specific eggs via the graphical presentation of the data.
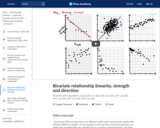
Describe a bivariate relationship's linearity, strength, and direction. In other words, plotting …
Describe a bivariate relationship's linearity, strength, and direction. In other words, plotting things that take two variables into consideration and trying to see whether there's a pattern with how they relate.
Statistics is the study of variability. Students who understand statistics need to …
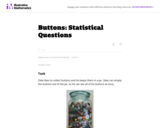
Statistics is the study of variability. Students who understand statistics need to be able to identify and pose questions that can be answered by data that vary. The purpose of this task is to provide questions related to a particular context (a jar of buttons) so that students can identify which are statistical questions. The task also provides students with an opportunity to write a statistical question that pertains to the context.
Submitted as part of the California Learning Resource Network (CLRN) Phase 3 …
Submitted as part of the California Learning Resource Network (CLRN) Phase 3 Digital Textbook Initiative (CA DTI3), CK-12 Advanced Probability and Statistics introduces students to basic topics in statistics and probability but finishes with the rigorous topics an advanced placement course requires. Includes visualizations of data, introduction to probability, discrete probability distribution, normal distribution, planning and conducting a study, sampling distributions, hypothesis testing, regression and correlation, Chi-Square, analysis of variance, and non-parametric statistics.
This task was developed by high school and postsecondary mathematics and design/pre-construction …
This task was developed by high school and postsecondary mathematics and design/pre-construction educators, and validated by content experts in the Common Core State Standards in mathematics and the National Career Clusters Knowledge & Skills Statements. It was developed with the purpose of demonstrating how the Common Core and CTE Knowledge & Skills Statements can be integrated into classroom learning - and to provide classroom teachers with a truly authentic task for either mathematics or CTE courses.
No restrictions on your remixing, redistributing, or making derivative works. Give credit to the author, as required.
Your remixing, redistributing, or making derivatives works comes with some restrictions, including how it is shared.
Your redistributing comes with some restrictions. Do not remix or make derivative works.
Most restrictive license type. Prohibits most uses, sharing, and any changes.
Copyrighted materials, available under Fair Use and the TEACH Act for US-based educators, or other custom arrangements. Go to the resource provider to see their individual restrictions.