
Introduction to price elasticity of demand. Created by Sal Khan.
- Subject:
- Economics
- Social Science
- Material Type:
- Lesson
- Provider:
- Khan Academy
- Provider Set:
- Khan Academy
- Author:
- Sal Khan
- Date Added:
- 07/27/2021

Introduction to price elasticity of demand. Created by Sal Khan.
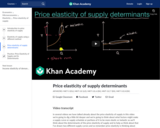
Explore what makes supply more or less elastic in this video.

Complements are goods that are consumed together. Substitutes are goods where you can consume one in place of the other. The prices of complementary or substitute goods also shift the demand curve. When the price of a good that complements a good decreases, then the quantity demanded of one increases and the demand for the other increases. When the price of a substitute good decreases, the quantity demanded for that good increases, but the demand for the good that it is being substituted for decreases. Take a deeper dive into how changes in the prices of complements and substitutes affect the demand curve in this video. Created by Sal Khan.

How states choose their delegates for the national party conventions (video content under CC-BY-SA license). Created by Sal Khan.

Two alleged criminals have been taken into custody. Will they remain loyal, or snitch each other out? Find out in this video! Created by Sal Khan.
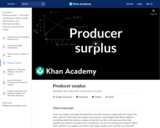
Producer surplus is the difference between the price a producer gets and its marginal cost. This means the producer surplus is the difference between the supply curve and the price received. Created by Sal Khan.
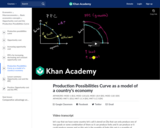
In this video, Sal explains how the production possibilities curve model can be used to illustrate changes in a country's actual and potential level of output. Concepts covered include efficiency, inefficiency, economic growth and contraction, and recession. When an economy is in a recession, it is operating inside the PPC. When it is at full employment, it operates on the PPC.

The production possibilities curve (PPC) is a graph that shows all of the different combinations of output that can be produced given current resources and technology. Sometimes called the production possibilities frontier (PPF), the PPC illustrates scarcity and tradeoffs. In this video, we model tradeoffs and scarcity using the example of a hunter-gatherer who can split their time between two activities. Created by Sal Khan.

Learn about the profit maximization rule, and how to implement this rule in a graph of a perfectly competitive firm, in this video.
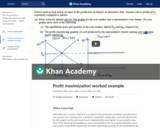
Work through a free response question about profit maximization in this video.

Figuring out the horizontal displacement for a projectile launched at an angle. Created by Sal Khan.

Visualizing position, velocity and acceleration in two-dimensions for projectile motion.

Prokaryotic and eukaryotic cells. Bacteria and archaea.

Advanced proof of the formula for the electric field generated by a uniformly charged, infinite plate. Created by Sal Khan.

We see that the infinite, uniformly charged plate generates a constant electric field (independent of the height above the plate). Created by Sal Khan.

Amplitude, period, frequency and wavelength of periodic waves. How to calculate wave velocity. Created by Sal Khan.

Market systems only function well when property rights are well defined. Take a deeper dive into the role of property rights in a market system in this video.

Overview of innovation and causes of prosperity and stability during the Song Dynasty (both Northern and Southern Song Dynasties). First movable type block printing, government sanctioned paper money, gunpowder, etc.

Three Punic Wars between Rome and Carthage mark the end of the Carthaginian (Punic) Empire and leave the Roman Republic dominant in the Mediterranean.

Put as Insurance. Created by Sal Khan.